Apr 182011
 

Download the source code for this post (5k)

Last time, we made an addin that wasnt very useful admittedly. This time we’ll fill it out a little and discuss some of the caveats involved in these sorts of things.

MyType

Now that we want to query memory, we’ll need to fill out the details of MyType. Let’s go with this:

struct MyType
{
    int Integer1;
    int Integer2;
    char * BigString;
    char * StringList[10];
    int StringIndex;
};

Get the latest project here (5k). Ultimately, we’ll look at three different ways to visualize this structure, but for now, we’ll focus only on the first two integers. The rough set of steps we need are:

  1. Get the pointer value from GetReadAddress()
  2. Query Integer1
  3. Check for read errors
  4. Query Integer2
  5. Check for read errors
  6. Compose the output string and return

If you look at the HandleMyType_TwoIntegers() function, you can see the steps called out. Notice that we check for errors a lot – this is very important! Treat your addin code as though you’re literally adding code to Visual Studio becuase that is in essence what you’re doing. If your addin crashes or scribbles on memory, it can destabilize Visual Studio.

On the bright side, we’re finally querying memory, and it’s pretty straight forward. Unfortunately, the code is hiding a lot of bad assumptions. We’ll get into that a little later after we cover the other two examples.

Example: Big String

The second example is a little more complex. We want to read a single string from a character pointer. This means we’re going to dig through a pointer indirection as well as deal with a string of indeterminate size.

C-strings are a common data type that might be read from a debugger addin, but dealing with them can be problematic. First, we have to get the string-pointer out of the structure and then we have to read the character data. Unfortunately, we don’t know how much data to query; it could be a single character or many kilobytes long. My solution is to query 1k at a time, concatenate the data, and then check the new data for the string terminator.

There is an additional caveat that I’ve encountered, however. On some platforms, if you read off the end of a valid memory page and into an invalid one, the read will simple be truncated. Other platforms will simply return a read-failure. As a result, I always read up to 1k at a time and clip the reads to page boundaries. There’s also the possibility that the string isn’t terminated at all. We don’t want to create a dangerous situation where we keep reading memory until we happen upon a terminating null by accident. So regardless of the data, limit the read to a reasonable length. Certainly limit it to the size of the results buffer.

Example: String Table

The truth is that the second example was too complicated. We could have accomplished it in the autoexp.dat file without any addin dll at all. I included it in order to introduce the string-reading code with minimal complications. The third sample on the other hand can’t be accomplished without one. We have an array of strings and an index. The output should be the string that corresponds to the index. This was meant to mimic standard identifier schemes that are used in some game engines.

The steps we have to take are:

  1. Get the pointer value from GetReadAddress()
  2. Query the StringIndex
  3. Check for read errors
  4. Bounds check the index value
  5. Calculate the offset into the string table at the index
  6. Query the pointer value at that offset
  7. Check for read errors
  8. Handle the NULL pointer case
  9. Query the string bytes at the pointer value
  10. Check for read errors
  11. Compose the output string and return

Assumptions and Caveats

The addins mechanism is fairly useful, but it gives you very little solid information on the nature of the target process or the hardware it’s running on. Earlier, we dealt with a potential problem reading strings, but there are several more places where we have incomplete information.

Fundamenal Data sizes

How big is an integer? It may be 32-bits on your development PC, but it could be 64-bits on the target process. More importantly though, how big is a pointer? The same PC might use 32-bits for some processes and 64-bits for others. Having data with potentially different sizes on the target process can also shift other data around inside of structures. While we’re on the topic of structures, we have to be aware of alignment. The example code has a copy of the structure in the addin, but that’s a cop-out. There are no guarantees that the local version and the target version are the same.

All of this is points to a need to be circumspect in how you structure your queries. Fortunately, there is a way to be 100% sure without making assumptions which we’ll cover in an upcoming post.

Endianess

Visual Studio is a Windows PC application, so the debugger is running natively as little-endian. However, you’re only ever reading raw data from target process memory. That means that all data you read is in the target’s endian-format. If you’re drilling through layers of pointers to pointers, you’ll have to read data, swap endian, read-data, swap-endian, etc etc.

Remember that endianess can apply to wide strings as well. Before we can convert a narrow string, we have to flip each character to be local-endian.

Next time

We’ve gone just about as far as we can go with bog-standard addin dlls in the autoexp.dat file. Next time, we’ll look at creating a more versatile kind of debugger addin that give us more certainty in dealing with the caveats, but with a marked increase in complexity.
Apr 182011
 

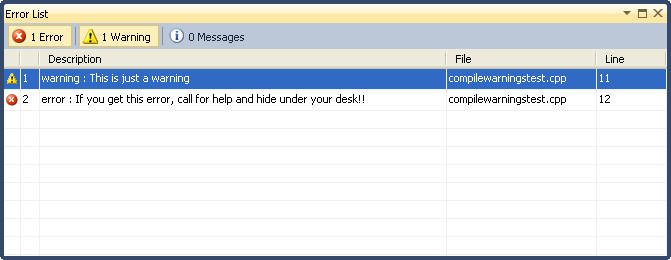
I had this kicking around on my hard drive, so I thought I ‘d throw it out there. It’s not exactly a big secret, but it certainly amused me when I wrote it. Use CWARNING and CERROR to add compile-time items to the Error List window in Visual Studio.

This is Visual Studio specific, but can be adapted to work with other compilers and environments. The use of __pragma appears to be Microsoft-specific, but the C99 and C++11 standards introduce the _Pragma keyword.

#ifndef _COMPILEWARNINGS_H_
#define _COMPILEWARNINGS_H_

#define __NUMTOSTRINGHELPER2(x)	#x
#define __NUMTOSTRINGHELPER(x)	__NUMTOSTRINGHELPER2(x)
#define __FILE_AND_LINE__       __FILE__"(" __NUMTOSTRINGHELPER(__LINE__) ")"

#define __ADDWARNING__(msg)     __FILE_AND_LINE__" : warning : " msg
#define __ADDERROR__(msg)       __FILE_AND_LINE__" : error : " msg
// edit 2014-24-02 - CINFO is not correct...still looking for the answer here
#define __ADDINFO__(msg)        __FILE_AND_LINE__" : info : " msg

#define CWARNING(msg)           __pragma(message(__ADDWARNING__(msg)))
#define CERROR(msg)             __pragma(message(__ADDERROR__(msg)))
#define CINFO(msg)              __pragma(message(__ADDINFO__(msg)))

#endif // _COMPILEWARNINGS_H_
CWARNING("This is just a warning");
CERROR("If you get this error, call for help and hide under your desk!!");
Apr 152011
 

Download the source code for this post (3k)

Greetings from Seattle! This is the start of a multi-part series about what I’ve learned about Visual Studio debugger addins while writing the FNameAddin.

First, however, we need to take a minute to discuss some basic stuff that most engineers I’ve met are aware of, but few bother to dig into. The autoexp.dat file is a peculiar beast in that you are encouraged to add to it, yet it is squirrelled away deep in the Visual Studio installation folder. It can be customized for your project, but has to be shared among all projects. All in all, it seems poorly thought out. We’ll blast through the really basic stuff first, so anyone who is seeing this for the first time should read up on the supplementary links.

AutoExp.dat

Deep in the Visual Studio install directory, at <VisualStudioInstall>/Common7/Packages/Debugger, there lives the autoexp.dat file. It’s just a text file, so go ahead and open it up and take a look around if you’ve never done that before. This is where you can give the Visual Studio debugger some hints as to how you want your data to be displayed in the watch window. There are three sections: [AutoExpand], [Visualizer], and [hresult]. We’ll only deal with the first one for the time being.

The AutoExpand section is fairly simple and quite well documented at the top of the file, so I won’t bother with it here. Sufficed to say, you can crack lots of simple data types by just adding them to the mix and possibly using one of the type suffixes. Go ahead and play around with this stuff. It’s very safe in that it won’t destabilize Visual Studio if you get it wrong, the debugger reloads the file every time you start a new debugging session, so feel free to edit and play around – just make a copy of the original file before you start. It’s always nice to revert in a pinch.

I’m far more interested in covering the $ADDIN-dlls functionality that is briefly mentioned. The file recommends looking at Microsoft’s EEAddin sample in order to get started, but you should use some caution. It turns out that EEAddin has been broken for as long as I can remember and will crash if you use it as-is – how unfortunate! So let’s take a different route. Let’s make our own sample: MT_Addin.dll. The process looks like this.

  1. Make a new Win32 DLL project called MT_Addin.
    • I ripped out the PCH plumbing to reduce the file count, but you’ll probably want to leave it in.
  2. Write your handler function using the correct function signature. (see below)
  3. Add a .def file so our handler function is exported with a nice undecorated name.
  4. Add an entry in the autoexp.dat file that references our Type, DLL and entry point
    • MyType=$ADDIN(<MT_AddinProjectDir>\Debug\MT_Addin.dll,HandleMyType)

You can download my sample project here (3k)

Ok, now let’s see what we have. Starting with the cpp file, we have our handler function with the following signature:


ADDIN_API  HRESULT  WINAPI HandleMyType( DWORD /*dwAddress*/
                                        , DEBUGHELPER * pHelper
                                        , int nBase
                                        , BOOL /*IsUnicode*/
                                        , char * pResult
                                        , size_t maxResult
                                        , DWORD /*reserved*/ );

There are a few things to note here. First, we declare the entry point as WINAPI which is just a #define for the __stdcall calling convention. This is what’s missing from the EEAddin sample that causes it to crash. Next, notice that we don’t use the dwAddress or bIsUnicode arguments. It might seem a little strange given that the whole point of this exercise is to look up addresses in the target process, but these are really just legacy arguments.

The most important thing here is the DEBUGHELPER. Strangely, you have to define the type for yourself even though the format isn’t under your control. (You can find it in MT_Addin.h) Fortunately, it’s not that complex and contains very little nuance.

dwVersion – Structure version – <0x200000 for VS6, >=0x20000 for VS7 and beyond
GetDebugeeMemory() – Useful for VS6 otherwise deprecated. Doesn’t support 64-bit pointers
GetRealAddress() – Gets the 64-bit value of the variable to be inspected. (Replaces dwAddress)
GetDebugeeMemoryEx()
– Query raw memory from the target process.
GetProcessorType() – Its use seems clear enough, but it always returns 0 for me.


Our example doesn’t do any memory queries at all, but it does create a simple string to tell you it’s working.  Finally, it returns S_OK for success – your addin should always return S_OK even when something goes wrong. When data can’t be interpreted correctly, you should return success and set the output string to “Error processing the data!” because returning an error will only display “???” in the watch window. Think of the return code to mean “The addin succeeded/failed” instead of “processing this data type succeeded/failed”

Installing, Testing, and Debugging

In order for Visual Studio to find your DLL, we have two options – specify an absolute path in the autoexp.dat file or copy our DLL into the “<VisualStudioInstall>\Common\IDE” folder. I recommend the former method because it prevents pollution of the Visual Studio folder, and it facilitates debugging the addin.

In order to test the addin, we need a second project that contains a type called “MyType”. At this point, it really doesn’t matter what MyType contains since our addin doesn’t actually query process memory. We just need the match the type name in order to invoke our handler – so go ahead and try it. If you put a MyType variable in the watch window, it should display, “Handled Data Type!!” Don’t worry, we’ll eventually make some memory queries.

Debugging these sorts of addins is fairly straight forward. Edit the addin project’s Debugging properties so that the Command item points to DevStudio IDE binary – it lives at “<VisualStudioInstall>\Common\IDE \devenv.exe”. When you run, your DLL won’t be loaded, so your breakpoints are invalid initially. Don’t worry about it though. The debugger will load your dll just in time and your breakpoints will go active. In fact, it will load and unload your any time it it’s required.

Next Time

Ok, that’s it for now. I think we have the basics pretty well covered. There’s a bit more to do with the standard addins, but hopefully things get a bit more interesting when we get to the Visual Studio extensibility framework.